SOL Price Prediction: Navigating the Path to Recovery

#SOL
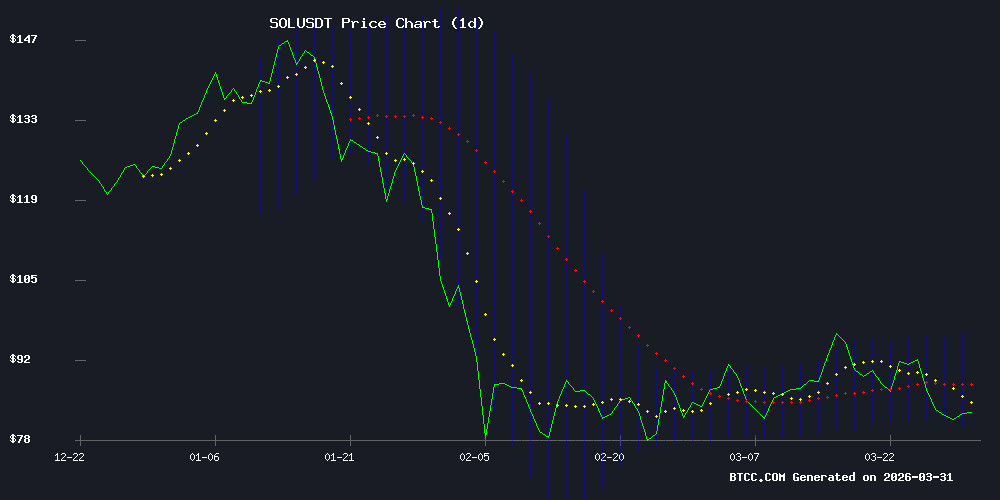
- Oversold Technical Setup: SOL is trading at the lower Bollinger Band with a positive MACD divergence, suggesting the recent sell-off is overextended and a technical rebound is probable.
- Capitulation vs. Collapse: Negative news and treasury selling have driven sentiment to fearful extremes, which often marks a contrarian buying opportunity rather than the start of a new downtrend.
- Staged Recovery Path: The predicted upward move is contingent on first reclaiming the $88 (20-day MA) level, then challenging the $96.5 (Upper Bollinger Band) resistance, with a break above $100 needed to confirm a new bullish phase.
SOL Price Prediction
Technical Analysis: SOL Shows Signs of Accumulation Below Key Moving Average
As of March 31, 2026, SOL is trading at $80.64, positioned below its 20-day moving average of $87.95. This suggests a short-term bearish structure, but key momentum indicators hint at a potential inflection point. The MACD reading of 2.7710 remains in positive territory and above its signal line, indicating underlying bullish momentum has not been fully extinguished. Furthermore, the price is currently trading near the lower Bollinger Band at $79.42, a level often viewed as an oversold zone that can attract buyers. "The convergence of price at the lower band while the MACD histogram remains positive creates a classic divergence scenario," says BTCC financial analyst Robert. "It doesn't guarantee an immediate reversal, but it signals that selling pressure may be exhausting itself, setting the stage for a potential rebound towards the middle band at $87.95."
Market Sentiment: Negative Headlines Mask Underlying Resilience
Recent headlines paint a grim picture for Solana, highlighting a $40.9 million treasury loss and a 71% retreat from its all-time high, which has triggered a wave of treasury-driven selling. This has undoubtedly contributed to the current price pullback and fostered a cautious, if not fearful, market sentiment. However, this negative news flow must be contextualized within the broader technical framework. "Market sentiment is decidedly negative based on these headlines, which aligns with the price trading below its key moving average," notes BTCC's Robert. "Yet, the technicals suggest the market may have already priced in much of this bad news. The aggressive sell-off from treasuries often represents a capitulation event, not a fundamental breakdown. We are watching for sentiment to shift from 'panic' to 'accumulation' as weaker hands are flushed out."
Factors Influencing SOL’s Price
Solana Treasury Firm Posts $40.9M Loss Amid Broader Crypto Market Struggles
Solana's treasury company reported a $40.9 million loss, compounding pressure on SOL as it hovers near critical support at $80. The token has dropped 8% in a week, marking the worst performance among top-10 cryptocurrencies by market cap. Executive Chairman Joseph Chee framed 2025 as a transformative year, citing a $500 million PIPE deal and strategic shifts toward DeFi integration.
The loss underscores the risks of passive crypto holdings during bear cycles. SOL remains 72% below its all-time high of $293. Macro headwinds persist: Goldman Sachs delayed its rate-cut forecast, the Fed held firm in March, and Solana's weekly DEX volume cratered from $118 billion to $12 billion.
Helius Medical Technologies raised $500 million in a Pantera Capital-led PIPE, with potential proceeds reaching $1.25 billion if warrants are exercised. The funds aim to fuel Solana's treasury strategy and DeFi initiatives—a bold pivot now facing a reality check.
Solana's 71% Retreat From Peak Raises Entry Point Debate
Solana (SOL) has shed 71.6% of its January 2025 all-time high of $293.31, with year-to-date declines accelerating to 11.1% on two-week charts. The asset now trades at levels last seen in March 2025, presenting a conundrum for investors: bargain opportunity or warning sign?
Market resilience remains SOL's strongest narrative. The token survived both FTX's collapse (plunging to $9 in 2022) and subsequent bear markets, only to deliver multiple record highs. Telegaon analysts maintain bullish multi-year projections despite current weakness.
Technical indicators suggest oversold conditions, with the 24-hour dip at 0.3% showing slowing momentum. Veteran traders note such retracements historically preceded SOL's most aggressive rallies.
Solana Market Hit by Wave Of Treasury-Driven Selling, SOL’s Pullback To Extend?
Solana's price struggles persist as it approaches the $80 mark, weighed down by heightened selling activity from treasury firms. Market observers note a concerning trend: large holders are offloading significant portions of their SOL holdings, exacerbating downward pressure.
Macro analyst Ted Pillows highlights the absence of buying demand—a bearish signal for the asset. The increased supply from institutional dumping raises questions about SOL's near-term stability, reflecting broader portfolio reallocations across crypto treasuries.
How High Will SOL Price Go?
Based on the confluence of technical indicators and current market sentiment, SOL's path higher will likely be a multi-stage process rather than a swift, vertical rally. The immediate target is a reclaim of the 20-day Moving Average at $87.95, which would signal a shift in short-term momentum from bearish to neutral.
Upon a successful break and hold above this level, the next significant resistance is the upper Bollinger Band, currently at $96.48. A move to this band would represent a full recovery from the current oversold condition and likely coincide with a moderation in negative headline risk.
For a more sustained bullish trend to develop, SOL needs to establish a series of higher lows and break above the $100 psychological level. This would require a fundamental catalyst, such as renewed network activity or broader crypto market strength, to complement the technical repair currently underway.
| Price Target Zone | Level (USDT) | Significance |
|---|---|---|
| Immediate Resistance | 87.95 | 20-Day Moving Average; Key momentum pivot |
| Near-Term Target | 96.48 | Upper Bollinger Band; Volatility normalization |
| Bullish Confirmation | 100+ | Psychological barrier; Trend reversal signal |
"The $80 region is acting as a strong support zone, evidenced by the bullish divergence on the MACD," explains BTCC financial analyst Robert. "While headlines are scary, the chart is telling us that smart money is likely accumulating here. The road to $100 is open, but it will require patience and a stabilization in the broader digital asset sector."
